Wanted to share this technique on labeling dimensions above bars as an alternative to the default top align in Tableau.
[iframely]https://public.tableau.com/profile/emily2933#!/vizhome/HowtoLabelAboveIndividualBars/HowtoLabelAboveIndividualBars[/iframely]
Step 1: Create a Bar Chart

Step 2: Create a Dummy Continuous Variable
Tableau doesn’t allow you to align above the mark in a bar chart.. so we need to get creative and create a second mark that sits above the one we want to label, then hide traces of that mark.
To do this, I’ve created a continuous variable for Tableau to create a second axis (remember, these green pills will always draw an axis and create another mark).
0.01 is an arbitrary value but preferably one that is very small relative to the actual value you’ll be displaying. In my case, I have sales rendering in the thousands, so a value of 0.01 is sufficiently small.
 Creating a dummy variable to draw a second axis and mark on the sheet.
Step 3: Bring the new Continuous Variable to the View.
Dual axis and pills and synchronize the values.

Step 4: Bring Measure Names to Rows
Here’s the key to how it all works: “measure names” on rows. You’ll find this pill in the dimensions panel. This will separate the the “Dummy” measure and the “Sales” measure into 2 bars.
Then on the “Dummy” mark, bring the Dimension you would like to label onto text. You should get something like this.
 The key to this is that we’ve plotted 2 measures together, but we’re only using the dummy measure/mark as a way to label the below bar. If you’re finding the label is below the bar, simply switch the order of the green pills in columns.
Step 5: Clean up your headers
Here I’m just hiding the headers we’ve created to structure the data in the view and remove distractions.

That’s it! Hope this was helpful. Let me know if you have any questions.
Happy Vizzing!


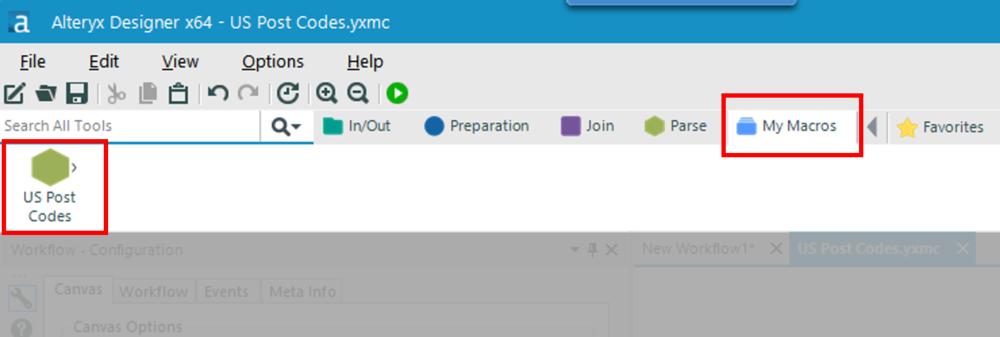
 Here I have a bookmark to a dataset of US post codes and their latitudes and longitudes.


