
Weighting Survey Data

I learnt this interesting technique while teaching a session for a management consultancy.

The question is to investigate the viability of a market – this can be learnt through survey data! But in order for our survey results to be useful, they should match the general “profile” of the country. This can be driven through demographic profiling such as age and gender. Ideally your sample should be already reflective i.e. if 20% of your population of respondents are women aged 18-25, then so should your survey responses.
But this isn’t always so easy to achieve! 

The next best thing is to weight your responses. This only works if you already have some population stats on your audience.

Say for instance we want to understand the market for a new Poutine product. Given its a regional speciality, the majority of our customers will probably be Canadian.

True population

Country% of population
Canada0.7
Italy0.1
Ireland0.1
UK0.1

Here’s a profile of the folks who have responded to our survey

Our Sample

CountryName% of population
CanadaEmily0.2
CanadaNai0.2
ItalyBene0.2
IrelandKevin0.2
UKBen0.2

If we profile our data, we see the profiles don’t match at all! But what can we do- getting survey samples to exactly match our population is time consuming and expensive.   

Country% of sample% of population
Canada0.40.7<< In our sample, 40% of respondents are Canadian. But our true market population will be 70%! 
Italy0.20.1<< Also our market has less Italians, Irish and British actually over-represent the actual scenario
Ireland0.20.1
GB0.20.1

But even if our sample is not representative of our population, we can create a new column that helps us redistribute the weighting and help us extrapolate correct trends to the country level.

  1. Prepare look up tables with population proportions calculated 
  2. Create a weight index– 
    1. Calculation is [% of population] / [% of sample]. This allows us to scale up demographics of our samples that are under-represented in our data. 
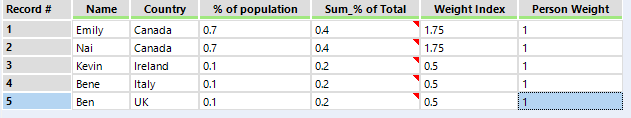
  3. The data comes out as so :

The Weight Index and Person Weight columns are the key parts of this technique. When summing up both columns, both total to 5 (as we have 5 respondents) but the weight index allows us to proportion more of our results to reflect the demographics we’ve matched against originally. 
I’ve attached a sample here if you’re interested in taking a review.


I hope you’ll get to use this technique with your next survey data use case!

Clustering Explained with a Small Dataset

Im going to break down how the clustering works on a small dataset. This is taken from a Machine Learning 101 session we did with Data Plus Women last year. It was a great session with Nitika Sharma so full credit goes to her work.

The Data

Lets take a look at the data and how it looks plotted. Taking a look at the visualiation, its pretty clear to me there are 2 clusters we want to draw out of the data. A+B could be 1 cluster and Points C+D should be another.
Point
X2
Y2
A
1
1
B
2
1
C
4
3
D
5
4

How does it work?

So lets assume you know that you want to find 2 clusters. How does it figure out what should be in those clusters? Once I explain this, you’ll feel like this probably could be more impressive- in fact you might have the impression like me that it was done with brute force!
It sets 2 centroids, so it’ll take 2 datapoints as its centroids. Then calculate the distance with pythagorian distance. Literally every point with every centroid. So in a dataset of 4 points, thats 8 calcs. then you assign each datapoint to the centroid with the smallest distance.

The Calculations

Lets use (1,1) + (2,1) as our centroids. Its arbitrary but it gives us a start. That means our data will start like this: Theres a lot of redundancy in the table– the original data table on the left is repeated twice and the centroids themselves are repeating along the rows.
Centroid 1
Point
X2
Y2
X1
Y1
A
1
1
1
1
B
2
1
1
1
C
4
3
1
1
D
5
4
1
1
Point
X2
Y2
Centroid 2
A
1
1
2
1
B
2
1
2
1
C
4
3
2
1
D
5
4
2
1


But this format allows us to really clearly see the following mathematical operations:


1) Finding the difference from the centroids 2) Squaring these differences 3) Adding the squares 4) finding the square root.

Step 1
Step 2
Step 3
Step 4
Centroid Points
Centroid
Find the difference
Square the difference
Add the squares
Find the square root
1
1
Centre 1
0
0
0
0
0
0
1
1
Centre 1
1
0
1
0
1
1
1
1
Centre 1
3
2
9
4
13
3.605551275
1
1
Centre 1
4
3
16
9
25
5
2
1
Centre 2
0
0
0
0
0
0
2
1
Centre 2
0
0
0
0
0
0
2
1
Centre 2
2
2
4
4
8
2.828427125
2
1
Centre 2
3
3
9
9
18
4.242640687
Each point gets assigned to a centroid based on the distance between the points and the centroids. Like so!
In this case, Points B, C, D are assigned to Centroid 2 and Point A to Centroid 1.

When Do New Assignments Form?

From here, we want to find the NEW centre. After all, we’ve kind of found 1 cluster. But if we redid this process again, will we gain the same results? This is the true test of if they are the clusters we are looking for! To do this, we compute new centroids based on the average of each of our new clusters– that is the average of B, C, D (the points assigned to centroid 2) and of Point A (centroid 1).
Step 2
Compute new centroids (only centroid 2 here)
B
2
1
C
4
3
D
5
4
New centroid is the average
3.6667
2.6666667


Then we do the distance calculation all over again. But notice here that in Point B, the distance is closest to Centroid 1. So actually Point B has be reassigned to Centroid 1! I’ve left out Point A here but the interesting part is happening in Point B. Point A will continue to stay assigned to Centroid 1.
Find the square root
Point
X2
Y2
X1
Y1
B
2
1
Centroid 2
3.666667
2.6667
2.357022604
C
4
3
Centroid 2
3.666667
2.6667
0.471404521
D
5
4
 Centroid 2
3.666667
2.6667
1.885618083
B
2
1
Centroid 1
1
1
1
C
4
3
Centroid 1
1
1
3.605551275
D
5
4
Centroid 1
1
1
5

When Does it Stop?

Then you repeat this process above until the assignments stop changing.

Final Thoughts

…and that is clustering on a small dataset! Thank goodness we have computers because when you think about it, its super annoying to have to do this for each new measure, and to check when the reassignments stop changing.
I really enjoy breaking down concepts like these with small datasets because it allows for myself to have a deeper set of knowledge without nearly as much confusion. Hope you enjoyed it too!

Market Basket Analysis Tableau – How To Find Products to Cross Sell Together

Say for instance you’re in the business of selling bookcases– but in the basket, what should be sold together to promote cross selling?

Lets show you how it can be done with Superstore data!

Step 1: Identify which orders contain the product, category etc which fit your criteria.


Step 2: Use this as an identifier against the whole order.

We can do this with an easy level of detail calculation! We are essentially isolating to each order OrderID (since its fixed to this in the calc) then checking against which is the max value. Since any string value is inherently larger than nothing (the null value), it will return the string and populate against each order ID.

Step 3: Place this new calculation on filters

This will bring back all orders where it contains bookcases. But it will also keep its accessory products!

From here its just about rearranging the view to find what other product categories are being sold with bookcases. Place a count distinct of order ID to columns with subcategory to rows.

The view below tells us that for the 224 orders that contain a bookcase sold, we also had 56 orders that sold at least 1 quantity of a binder.

But when I place profit onto color, this tells me that for the past bookcase orders, not only have 42 orders had a bookcase and a phone in the same basket. But I’ve also made a nice profit of $2,687 from customers buying these items together! This is probably important as we are not making a profit from Bookcases!

Interested in the workbook? Check it out on Tableau Public!

Thanks for reading!


Tableau 2017 – Conference Tips!

If you’re headed to the conference, here’s a couple of pointers to prepare/look out for. I would highly recommend being organised so you can be open to random opportunities that arise.

General

  • If you have food allergies – pack accordingly. There’s food everywhere but all pickup food stations
  • Comfy walking shoes. The conference is MASSIVE and you’ll be on the go from breakfast of 3AM for a week.
  • Buy Conference Swag ASAP. The store was clear out by Thursday. You can always order online but its just not the same!

Learning at Conference

  • Plan your sessions ahead of time (and create back up plans). I did my schedule in Excel so I could keep track of it all. Take into account the travel time between venues if you can.
  • Make your life easy and just let go of the FOMO. There are so many amazing events and sessions. It’s going to happen – so just be happy with the plan you’ve committed to. I remember feeling so much stress on my first day and Emma from TIL also shared this sentiment. Her advice? You gotta let it go!
  • Feel free to leave a session, if a session is really terrible/too full for you to absorb information. Its about making the most of it for you.
  • Check out the Vendor Expo. I think of it as a professional development session in itself! Ask lots of questions– they’ll be happy you did.
  • Take notes during sessions. I carried my laptop around.
  • Pick good speakers. Its also tough for those preparing the sessions – its a lot of work! Some might not have a had enough time, not great public speakers etc.. so that’s going to reflect in the end product.
  • Get good seats. Last year, people in the back probably had a hard time because many of the rooms were long and skinny with no screens for the back end of the crowd.

FUN!

  • Create a WhatsApp group with your travel mates
    • With 15,000 people, you’ll need it to help navigate where’s the best sessions, events etc.
  • Go out and socialize. Tableau folks are some of the friendliest, quirky data analysts around. What a world of difference it makes to meet them in person!

That’s all I can think about for now. Any others I missed? Let me know in the comments!

See you in Vegas!

Emily