
How to Create Bar Charts and Line Plots

Wanted to share the Tableau Tip I’ll be presenting at tomorrow’s Tiny Talks meetup session.

The video is of one of my favorite visualizations – Bar Charts and Line Plots.

They are easy to build yet very insightful. You can quickly answer the high level question through the bar chart but also understand the distribution of more granular data that roll up to make that result.

To me, understanding the breakdown is what helps translate data into tactical, actionable plans.

My first video tutorial as well.. Hope you like it! Here’s the workbook if you’d like to take a look.

Data Plus Women – July 2016

Great event. Look at that turnout!

Full house y'all! Full house y’all!

Key Takeaways

– Lots of people showed up – men and women! Also many new faces to the Tableau and Data community alike.

– Great speakers from The Information Lab‘s Data School and  Schroders.

– Learning about out of the box methods to apply data in the real world.

Kalpana Chari shared her Schroders hackathon creation Kalpana Chari shared her Schroders hackathon creation “Ada”, a Lync bot fed data through Tableau Server.

Kalpana from Schroders shared a fun piece of work that allows her investment teams become more agile with data. When she envisioned this was for the asset manager on the run, who quickly needed to pull a number, I was thinking… talk about solving a pain point!

She mentioned her inspiration stemmed from Andy Cotgreave’s charts in tooltips using ASCII characters. Funny enough, there’s been 2 articles released recently by Rody Zakovich and Jeffrey Schaffer recently about different ways to enhance your vizzes.

Questions from the audience were around how she’ll be able secure the data once its fully implemented. In her case, she’s deploying through Active Directory with Tableau Server– so as secure as her security architects have been able to make it. Kalpana put it in a rather interesting way – the system knows more about you than you do about the data!

Another question came up how long did it take for her to create this or learn how to do it. With no programming background, her answer was brilliant:

Get really good at knowing how to Google things.

Apparently a skill passed down from her manager. His response to questions was iterations of “here’s what you google”. Its quite a different task to being sent the “let me google that for you” link as it teaches people how to think about breaking down a problem. Fabulous skill in life and our data careers.

Lorna about to present her Krispee Kreme donuts viz. Lorna about to present her Krispee Kreme donuts viz.

Lorna Eden came down all the way from Warrington to present the design method in her fun viz on donuts. We also had Krispee Kreme donuts to go with it!

We also got a suggestion on Twitter as to whether or not we’ll periscope the events. We’ll try for next time!

Data + Women London has made great progress – we’re in the midst of confirming our next meetup for September 1st with Sky.  We’ve confirmed our 1st speaker – Alexandra Hanna will be presenting how JISC+HESA are joining forces to unleash BI in their organization. Must attend for those in Higher Education!

Any questions or suggestions, tweet us at our new twitter account @datawomenldn.

How to Prevent Cross Filtering in Tableau

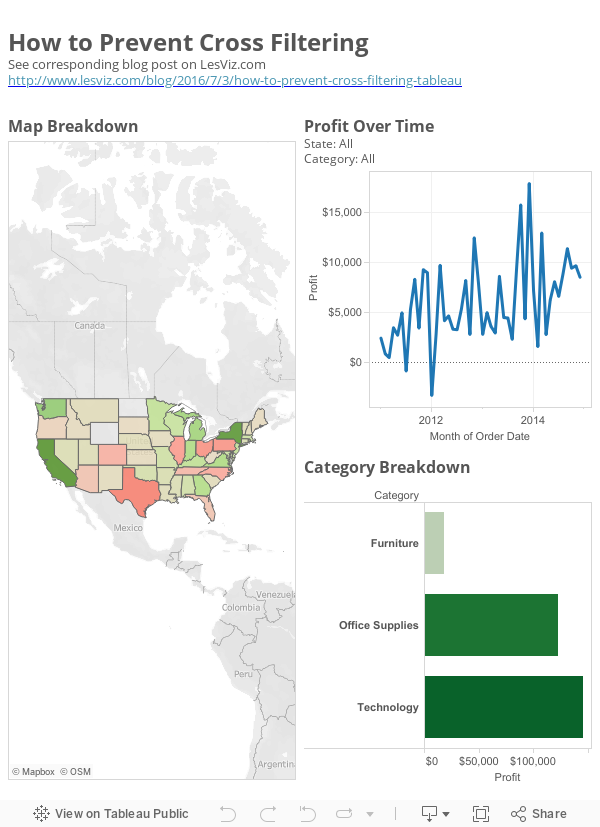
Assume we have a dashboard that’s something like the below. I want to be able to filter the line chart by either the map or the bar chart, but not by both at the same time. This is a simple method in restricting how users will be able to access your data without using Tableau Server’s user filters.

Its a very specific use case and a bit tricky for 2 reasons:

1) Single Select only works on 1 sheet whereas I need to select between 2 sheets which host 2 different dimensions – so I end up with unintentional cross filtering.

2) Adding the individual dimensions into dashboard actions will ask for a particular combination of the two, whereas I want the default “all” option to persist when the alternative action is chosen. i.e. for 1 state, show me all sales for all categories OR for 1 category, show me the sales for 1 state.

The interesting part of this trick is we’re using 2 ways to “clear” a sheet

– using a custom value list in filters to not show values in the sheet using the exclude function.

– using dashboard actions to exclude values when no values are selected.

Using these 2 princples (and 2 sheets) allow us to only filter 1 way because they are sourced from different sheets. Effectively only 1 of the sheets will provide the actual filtering but the other sheet provides the state breakdowns when categories are chosen

How do we do this?

There are 2 key mechanisms at work with this

– You’ll need 2 action filters and 2 maps. Each map will “collapse” but under 2 different conditions:

Part 1: Duplicating the Map into an Original Sheet and Secondary Sheet

Simply right click and duplicate the tab so you end up with 2 maps. Make sure you keep track of which one is the original and the secondary.

Part 2:  Setting the Original Map to Collapse When there’s Only 1 Dimension in the View

1) The original map will collapse when it detects there is only 1 category dimension in the view. Something like this in filters.

Convert the pill into a discrete measure….

Then drag it filters and configure it with a custom value list of “1”, excluding this value. This is because we are asking Tableau “clear” the sheet when there’s only 1 category in the view.

Part 2: Setting up Dashboard Actions.

We’ll need 2 dashboard actions – the first is to set the filtering action and the second is for the secondary map to “clear” when nothing is selected.

Setting the filter to act as per usual:

Setting the filter to collapse the secondary map (“New Map”)  when nothing is selected. Notice that the line chart is not selected here since we want the line to continue to show.

Essentially, you won’t want the new sheet to show until 1 category is selected. But based on what we did in Step 2, the original sheet will collapse when 1 category IS selected. A bit of a switcheroo!

At this point, you can put the maps into a container and with a bit of adjustment, the sheets should be show/hiding with the functionality above.

Hope that helps- let me know if you have any questions.

50 Shades of Color with Matt Francis

It was only last year I had just met Matt Francis at TC15 in London. I was 2 weeks into Data School and being thrown into Tableau world, and we were just chatting about his color session at TC15 in Vegas (the big one!) later in the year.

Time flies!

My key takeaway is that color is a very subjective but powerful element in communicating stories. Matt did this really well with his carefully chosen photos of evocative landscape. Indeed, just as data drives viz type, data also drives color.

I like that someone’s spelled out for me that this is actually a very subjective world to recommend best practice. I also really like the fact that we have to recognize that color plays off of a lot of our heuristics to drive impact. Quite the double-edged sword. So when recognizing that your color choices are pre-processed with someone else’s associations, make sure you dont distract from your message unintentionally.

And finally we have a middle ground approach to the red/green color blind debate. I’ll admit that the only reason I don’t do any red/green color palettes is only to avoid ridicule from my visualization compatriots. Matt makes excellent points on this in that if the audience is just for your, and its for a few people, then red/green is ok. (So Tableau Public is still a no-go zone)

There are a couple other tactical tips to take away such as:

– Orange is a good color with highlighting. Works great against grey. Its interesting, but not passing judgement

– Use tabpal.co to create a color palette based on a chosen picture

– Save your favorite color palettes with Tableau preferences files

Time to start building color schemes on all my pinterest boards!!