Histograms are great for helping us understand distributions of data, but Tableau currently doesn’t allow for the ability to label the upper and lower bounds of bins ranges.
Much thanks to Rob Suddaby for asking this question and to Robin Kennedy for his great answer.
Feel free to download the workbook from Tableau Public

Step 1: Create a Calculation
Here I’ve built in a parameter so I can adjust the size of the bins dynamically. If you only need it be a certain size, simply replace the purple fields with your bin size.
str(INT([Fare]/[Bin Size])*[Bin Size]) + ‘ – ‘ + str(INT([Fare]/[Bin Size])*[Bin Size]+[Bin Size])

The calculation works in 2 parts:
1) Calculating the upper and lower bound of the range.

2) Converting these values to strings and adding formatting with the “-”

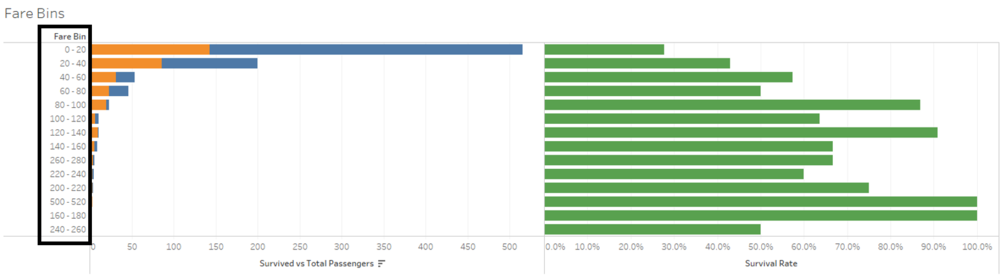
Step 2: Build your view!

Thanks for reading!
Just what I was looking for. Thanks!
Just what I needed. Worked like a charm. Thanks!
Agree – great job
Worked like a Charm! Thanks a lot:)
If your measure has a wide range (as mine Unit Price is) you can use the “LOG” functionality to create bins that have uneven sizes. Putting the Parameter on the dashboard gives the user the option to “play” with the outcome.
if [Unit price] ” else
“[” + str(Power([Parameter] ,int(log([Unit price],4))) ) +”;” +
str(Power([Parameter],int(log([Unit price],4)+1)))+”>”
END