
How to Update Multiple Filters with 1 Click

I came across a dashboard at the client site with a pretty nifty trick. Big thank you to Charlotte Horgan for this innovation 😀

Ever found it annoying when you have multiple filters active on many sheets in a dashboard?

You would make your selections in 1 filter… then wait for the dashboard to update, then the next filter would have to update.. and the whole process just takes a little too long especially if you have many marks on your vizzes.

Is there a solution? Yes – with action filters!

Step 1: Establish your Level of Detail to filter your vizzes 

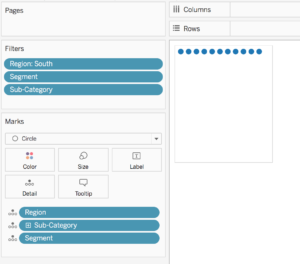
Create a new sheet with all the filters you want applied to your dashboard to your sheet as well as having them on detail.

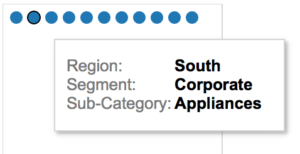
Notice that Tableau has started to draw many circles? There’s exactly 11 marks to reflect the unique combinations of Regions, Subcategory and Segment in the viz.

Step 2: Create the following IF statement

iif(first()=0,”Update Dashboard”,null)


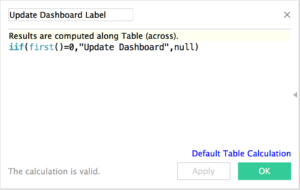
Step 3: Place this calculation on rows and set ‘compute using’ to cell

As I mentioned, each mark represents each unique value of the dimensions in the view. Therefore to create a “one button” experience, we’ll have to figure out how to select all the marks at 1 time.

In this case, I’ve set the table calculation’s partition to “reset” to every new value in the view. This way, the calculation will always return a value of TRUE (which is this case is “Update Dashboard”). So I will always select all the marks at 1 time. We see this is working because we’re only returning 1 header in the view.


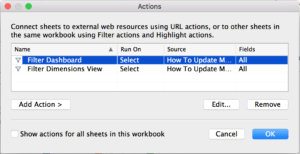
Step 4: Start building your viz and set up action filters

Here’s the layout of my dashboard. The filters are from the “Update Dashboard” sheet with no filters on the other visualizations. Make sure the filters are only applying to the “Update Dashboard” sheet.


In mine, I have 2 action filters but only the first one is necessary to make this work.


Step 5: Enjoy and test your viz!

Here’s my example workbook:

[iframely]https://public.tableau.com/views/HowtoUpdateMultipleFilterswith1Click/HowToUpdateMultipleFilterswith1Click?:embed=y&:display_count=yes[/iframely]

How to Scale Tableau User Filters in 5 Steps

I’ve been working on a sales dashboards where I am visualizing a set of transactional data. One of the requirements was for Tableau Server to recognize the user and their territory upon login. Easy peasy with Tableau User Filters right?

I want to show you how you can do this easily if you have the following complications:

  • Multiple sales reps to 1 region– joining these two datasets will multiply your records (and over-report sales dramatically!).
  • Have a large number of users (I have over 100 reps) and no time to update it manually and constantly as the team changes.
  • Lots of sheets in your workbook and did not want to spend the time adding the user filter set to every sheet.
  • You also dread Tableau’s inevitable “*” error on a blends for your joining table.

Big thanks to the Great Chris Love for this tip!

Step 1: Find Your List of Users and Pivot your Data

You’ll need 2 pieces of data – assigned Tableau Server Usernames, and their respective regions. I’ve mocked up a dummy data set to help illustrate with our favorite retail store – Superstore. Usually the USERNAME() function will be a reflection of your organization’s system username if your Tableau Server is using Active Directory to authenticate/login your users.

As you can see, we have 4 sales regions at Superstore, and 2 sales reps look after each region.

Quick view of my raw dataset

Tableau Usernames for Tableau User Filters

We need to pivot the data so it ends up as a lookup table, but concatenating usersnames to sit in 1 cell. I did this bit in Alteryx.

Alteryx Workflow for Tableau User Filters -Here’s what my workflow looked like with annotations. Alteryx Workflow for Tableau User Filters -Here’s what my workflow looked like with annotations.

BONUS TIP! Did you know you could annotate your tools instead of using the comments box? Much easier when you’re moving around tools in your workflow.

Step 2: Join your lookup table against your transactional data and output your data into Tableau!

Step 3: Connect your output (.tde/.csv) into Tableau and login to your Tableau Server

Connect your data source and sign into Tableau Server. Connect your data source and sign into Tableau Server.

Step 4: Create the following calculation:

Since our usernames are concatenated to exist in 1 cell for every territory, this creates the association between 1 territory and many usernames upon a user’s sign-on.

Step 5: Create a data source filter using the calculation above and Select “True”.
The calculation will look up the username and will filter to the territory specified in your lookup table (now joined against the transaction data)

That was the last step!

You can use the navigation at the bottom to change users views just as you would with a set recommended by Tableau. Hopefully you’ll use this clever method of data pivoting to bring a better UI experience to your Tableau Server users.

If you’d like to download this workbook to see the other calculations, visualisations I have used, you can access the workbook here. Note that the filter will not work with your Tableau Server so I have removed it to avoid confusion.